{{Governance}}
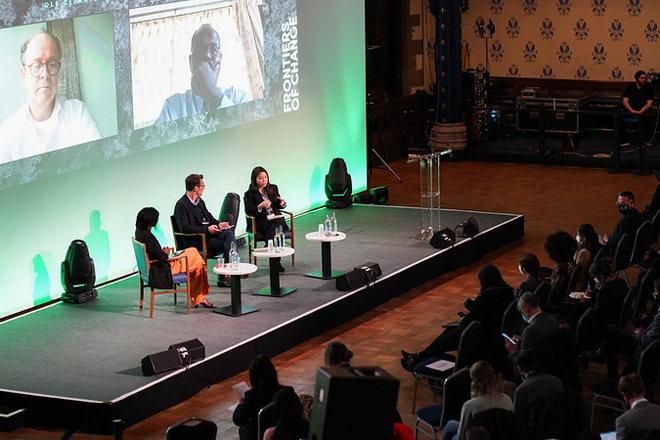
Explore eventos futuros e passados em todo o mundo e online, sejam hospedados pelo CIFOR-ICRAF ou com a participação de nossos pesquisadores.
ÚLTIMAS NOTÍCIAS
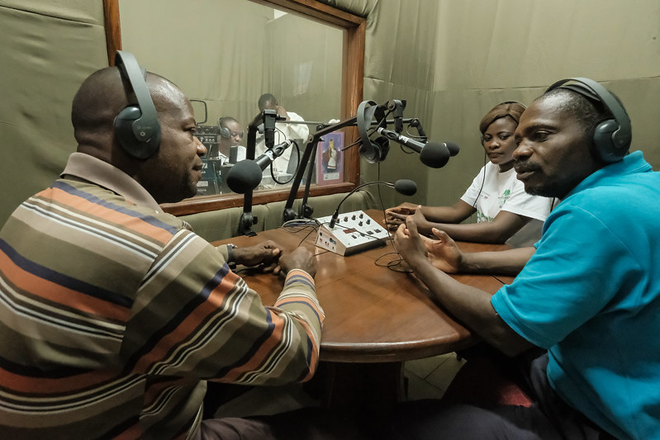
A ciência precisa de canais de comunicação claros para cortar o ruído, para que a pesquisa tenha algum impacto. O CIFOR-ICRAF é tão apaixonado por compartilhar nosso conhecimento quanto por gerá-lo.

Découvrez les évènements passés et à venir dans le monde entier et en ligne, qu’ils soient organisés par le CIFOR-ICRAF ou auxquels participent nos chercheurs.

Jelajahi acara-acara mendatang dan yang telah lalu di lintas global dan daring, baik itu diselenggarakan oleh CIFOR-ICRAF atau dihadiri para peneliti kami.

Actualités
Pour que la recherche ait un impact, la science a besoin de canaux de communication clairs pour aller droit au but. CIFOR-ICRAF est aussi passionné par le partage de ses connaissances que par leur production.

ÚLTIMAS NOTICIAS
Para que la investigación pueda generar algún impacto, los conocimientos científicos requieren de canales de comunicación claros. En CIFOR-ICRAF, compartir nuestros conocimientos nos apasiona tanto como generarlos.

Explore eventos futuros y pasados organizados por CIFOR-ICRAF o con la participación de nuestros investigadores.
{{menu_nowledge_desc}}.
{{menu_nowledge_tab_2}}
{{Europe}}
Kabar terbaru
Ilmu pengetahuan membutuhkan saluran komunikasi yang jelas untuk mencapai tujuan, jika ingin dampaknya terlihat. CIFOR-ICRAF sangat bersemangat untuk berbagi pengetahuan sembari menghasilkan pengetahuan itu sendiri.
{{menu_research_desc}}
Our solutions to five global challenges

{{Governance}}

CIFOR–ICRAF achieves science-driven impact. We conduct innovative research, strengthen partners’ capacity and actively engage in dialogue with all stakeholders, bringing the latest insights on forests, trees, landscapes and people to global decision making.
Our solutions to five global challenges

CIFOR–ICRAF publishes over 750 publications every year on agroforestry, forests and climate change, landscape restoration, rights, forest policy and much more – in multiple languages.
Explore our knowledge
Browse CIFOR–ICRAF’s published research in a wide range of formats, all of which are available for free online.
This section includes knowledge products from CIFOR and ICRAF published since 2016. Please visit cifor.org or worldagroforestry.org for older publications, which will be added to this site over time.

Explore upcoming and past events across the globe and online, whether hosted by CIFOR-ICRAF or attended by our researchers.

Latest news
Science needs clear communication channels to cut through the noise, if research is to have any impact. CIFOR-ICRAF is as passionate about sharing our knowledge as we are in generating it.

CIFOR–ICRAF addresses local challenges and opportunities while providing solutions to global problems for forests, landscapes, people and the planet.
We deliver actionable evidence and solutions to transform how land is used and how food is produced: conserving and restoring ecosystems, responding to the global climate, malnutrition, biodiversity and desertification crises. In short, improving people’s lives.
Governance
For general inquiries
The Center for International Forestry Research and World Agroforestry (CIFOR-ICRAF) harnesses the power of trees, forests and agroforestry landscapes to address the most pressing global challenges of our time – biodiversity loss, climate change, food security, livelihoods and inequity. CIFOR and ICRAF are CGIAR Research Centers.
For general inquiries:
For media inquiries contact:
Subscribe to the CIFOR-ICRAF news update
© 2024 Center for International Forestry Research (CIFOR) and World Agroforestry (ICRAF) | CIFOR and ICRAF are CGIAR Research Centers | Privacy notice of CIFOR-ICRAF

